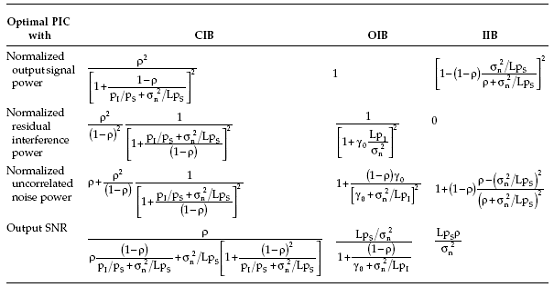
A comparison of the various results is presented in Table 1. The output signal power, residual interference power, and output uncorrelated noise power of the optimal PIC are, respectively, normalized by PS, PI(1 − ρ), and σn^2/L. These quantities correspond to the signal power, the interference power, and the uncorrelated noise power at the output of the signal beam. This particular form of normalization is chosen to facilitate the comparison between the performance of the PIC using the OIB, IIB, and CIB, and that of anelement space processor using conventional weights (the signal beam is formed using conventional weights). It follows from Table 1 that the SNR of the optimal PIC for the three cases is the same when ρ is equal to unity or, equivalently, when the steering vectors in the signal and interference directions are orthogonal to each other. The case of ρ < 1 is now considered. For this situation, the results of the optimal PIC with the three interference beamformers are discussed and some examples are presented. All examples presented here are for a
linear array of ten equally spaced elements with one-half wavelength spacing. The signal direction is broadside to the array, and the uncorrelated noise power on each element is equal to 0.01. The interference beam for the OIB case is formed using the steering vector in the endfire direction. Thus, knowledge of the interference direction is not used in selecting Uo.

Table 1 : Comparison of Normalized Signal Power, Interference Power, Uncorrelated Noise Power and SNR at
the Output of the Optimal PIC Forming Interference Beam with CIB, OIB and IIB,
Signal Suppression
From Table 1, the following observations about the normalized output signal power of the optimal PIC for the three cases can be made:
1. The optimal PIC using the OIB does not suppress the signal; in the other two cases the signal is suppressed. The signal suppression by the optimal PIC using the CIB is more than that by the PIC using the IIB. This follows from the following expression for the difference of the normalized output signal powers:
 |
(6.83) |
Physically, the interference beam rejects more of the signal in the IIB than in the CIB and rejects all of the signal in the OIB. This leads to no suppression of signal by the PIC using the OIB and less suppression in the case of the IIB than that of the CIB.
2. The normalized output signal power of the optimal PIC using the IIB is independent of the interference power. In the case of the optimal PIC using the CIB, it increases as the interference power increases. Thus, it follows that the difference between the normalized output signal power for the two cases decreases as the interference power increases. In the limit the difference approaches
 |
3. The normalized output signal power depends on the input signal power for both the CIB and IIB cases. In the case of the optimal PIC using the CIB, it decreases as the input signal power increases. Thus, the signal suppression increases as the input signal power increases. However, in the case of the optimal PIC using the IIB, the normalized output signal power increases as the input signal power
increases, approaching unity in the limit. Thus, the signal suppression is negligibly small when the input signal to uncorrelated noise ratio is large.
Figure 14 and Figure 15 show plots of the normalized output signal power of the optimal PIC using OIB and IIB when the interference power is 1.0 and using the CIB when the interference powers are 0.01, 0.1, and 1.0. For Figure 14, the interference is at an angle of 60° from the signal while for Figure 2.15, the angle is at 5°. The parameter ρ for these cases is 0.99 and 0.48, respectively. Note that for both the cases the normalized output signal power of the PIC using the CIB increases as the interference power increases. Signal suppression by the PIC using the CIB increases as the input signal power increases in both cases, but the signal suppression is greater in Figure 15 (ρ = 0.48). This is because more signal leaks into the interference beam for the scenario of Figure 15 than for Figure 14.

Figure 14 : Normalized output signal power of the PIC using the OIB with PI = 1; the IIB with PI = 1; and the CIB with PI =
1, 0.1 and 0.01 vs. input signal power for a ten- element linear array, θ0 = 90°, σn^2 = 0.01, θI = 30°.
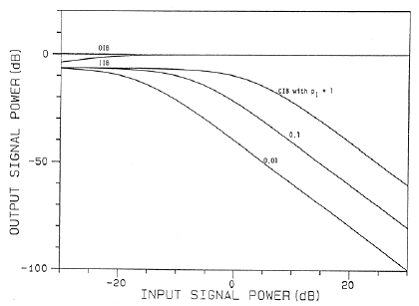
Figure 15 : Normalized output signal power of the PIC using the OIB with PI = 1; the IIB with PI = 1; and the CIB with PI =
1, 0.1 and 0.01 vs. input signal power for a ten-element linear array, θ0 = 90°, σn^2 = 0.01, θI = 85°.
Residual Interference
The following observations about the residual interference can be made:
1. The output of the optimal PIC using the IIB does not contain any residual interference; in the OIB and CIB cases, residual interference is present.
2. For the optimal PIC using the OIB, the normalized output residual interference depends on PI/σn^2 and the number of elements in the array. As PI/σn^2 increases, the normalized residual interference decreases and approaches zero in the limit. As this ratio decreases, the normalized residual interference increases but never exceeds unity. Thus, the optimal PIC using the OIB always cancels some of the interference present at the output of the signal beam. The interference cancelation increases as PI/σn^2 and the number of elements in the array increase.
3. As presented in Table 1, the expression for the normalized residual interference at the output of the optimal PIC using the CIB is a product of two terms. The first term depends on the parameter ρ, which in turn is controlled by the array geometry and the relative directions of the two sources: for ρ greater than one-half, the term exceeds unity. The second term depends on σn 2/LPS and PI/PS, and increases as these parameters decrease (stronger signal), in the limit approaching unity. It follows that the normalized residual interference at the output of the optimal PIC using the CIB increases as the signal power increases, and approaches a limit that is more than unity when ρ < 0.5. Thus, in certain cases, the interference power at the output of the optimal PIC using the CIB may be more than the interference power at the output of the signal beam.
Comparisons of the normalized residual interference at the output of the optimal PIC using the CIB and OIB are shown in Figure 16 and Figure 17. The interference directions are 5° and 60° off broadside, respectively. The signal power is assumed to be unity. These figures show plots of the interference power at the output of the optimal PIC normalized by the interference power at the output of signal beam. Thus, the interference level above the 0 dB line indicates an increase in the interference power from that present in the signal beam.
Figure 16 (the interference and signal are 5° apart, ρ = 0.48) shows that the optimal PIC in both cases cancels some interference present in the signal beam. However, the cancelation is very small for the lower range of the input interference and increases as the input interference increases. For the lower range of the input interference power, the optimal PIC using the CIB cancels slightly more interference than that using the OIB. The reverse is true at the other end of the input interference range. The optimal PIC using the OIB cancels about 10 dB more interference than that using the CIB when the input interference power is unity.
Figure 17 shows the normalized output interference of the optimal PIC using the OIB and CIB when the interference and the signal are 60° apart (ρ = 0.99). The figure shows that for the lower range of the input interference, the residual interference at the output of the optimal PIC using the CIB is about 40 dB more than the interference contents in the signal beam. Thus, the optimal PIC using the CIB does not suppress weak interference, but increases its level. In the case of the optimal PIC using the OIB, when the input interference power is very small, some interference reduction takes place. The reduction is about 2 dB.
For both cases, the normalized output interference decreases as the input interference power increases. For the entire range of input interference level, the residual interference at the output of the optimal PIC using the CIB is about 42 dB more than that using the OIB.
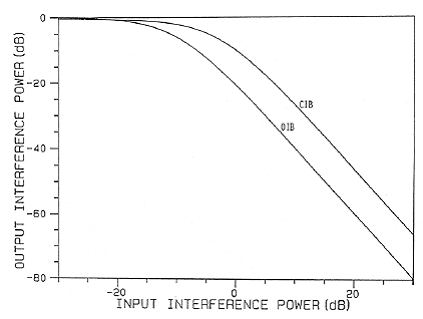
Figure 16 : Normalized residual interference power of the PIC using the OIB and the CIB vs. input interference power for
a ten-element linear array, θ0 = 90°, PS = 1.0, σn^2 = 0.01, θI = 85°.
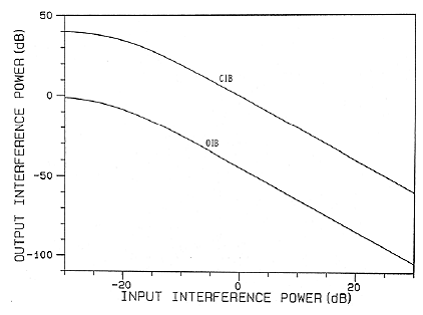
Figure 17 : Normalized residual interference power of the PIC using the OIB and the CIB vs. input interference power for
a ten-element linear array, θ0 = 90°, PS = 1.0, σn^2 = 0.01, θI = 30°.
Uncorrelated Noise Power
A comparison of the normalized uncorrelated noise power at the output of the optimal PIC for the CIB, OIB, and IIB is shown in Table 1. The table shows that the normalized uncorrelated noise power at the output of the optimal PIC using the OIB is greater than unity. In other words, the optimal PIC has increased the uncorrelated noise.
For the case of the optimal PIC using the IIB, the decrease or increase in the uncorrelated noise power depends on the difference between the parameter ρ and the square of the uncorrelated noise to signal ratio at the output of the signal beam (σn^2/LPS)^2. The normalized uncorrelated noise power at the output of the PIC is more than unity when ρ > (σn^2/LPS)^2. Thus, in the presence of a relatively stronger signal source, the optimal PIC using the IIB increases the uncorrelated noise power.
Signal-to-Noise Ratio
First a comparison between the SNRs of the PIC using the IIB and OIB is considered. It follows from (6.75) and (6.82) that
 |
(6.84) |
| which implies that | |
| (6.85) | |
| Furthermore, for ρ ≈ 1 | |
| (6.86) | |
| Now consider the PIC using the IIB and CIB. It follows from (6.60) and (6.82) that | |
 |
(6.87) |
| Thus | |
| (6.88) | |
| Furthermore, for low values of α1 | |
| (6.89) | |
| Note that | |
 |
(6.90) |
| is the SNR at the output of the interference beam. |
The above discussion agrees with the comparison of the output SNRs for the IIB, OIB, and CIB cases shown in Figure 18 and Figure 19. For these cases, a unit power interference is assumed to be present. The direction of the interference is 60° from broadside in Figure 18 and 5° from broadside in Figure 19. The parameter ρ is 0.99 and 0.48, respectively, and the parameter γo is 0.17 and 0.01, respectively. One observes from these figures that in the case of the CIB, the output SNR decreases as the input SNR increases beyond −8 dB in Figure 18 and beyond −16 dB in Figure 19. However, in the other two cases the output SNR increases as the input SNR increases, resulting in array gains of the order of 20 to 30 dB.
In the next section, a comparison of the optimal element space processor (ESP) and the optimal PIC with an OIB is presented. It should be noted that the ESP is optimized to minimize the mean output power subject to a unity constraint in the look direction and the PIC is optimized to minimize the mean output power with the interference beam having a null in the look direction.
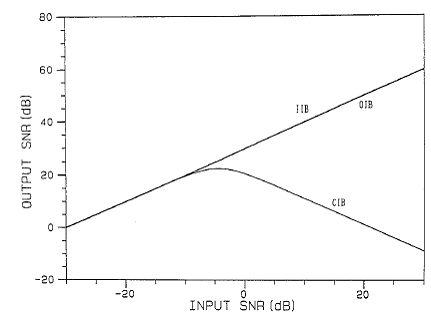
Figure 18 : Output SNR of the PIC using the OIB, the IIB and the CIB vs. input SNR for a ten-element linear array, θ0 = 90°,
PI = 1.0, σn^2 = 0.01, θI = 30°.
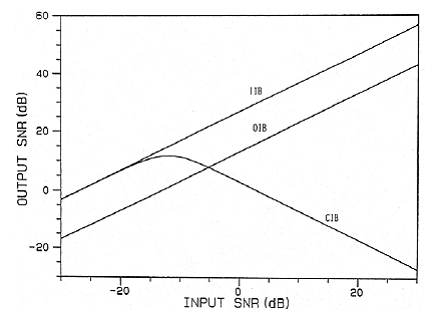
Figure 19 : Output SNR of the PIC using the OIB, the IIB and the CIB vs. input SNR for a ten-element linear array, θ0 = 90°,
PS = 1.0, σn^2 = 0.01, θI = 85°.
Back to PIC.
Back To Contents .