PIC with Conventional
Interference Beamformer
Let the interference beam be formed with the beamforming weights,
(6.51) |
This choice of beamforming weights ensures that the response of the beam in the interference direction is unity. Note that these weights are not constrained to block the look direction signal passing through to the interference beam as was done using blocking matrix B in the previous discussion. This particular interference beam highlights the effect of the signal present in the auxiliary beams. It follows from (6.50) and (6.51) that the response of the interference beam in the signal direction is the same as that of the signal beam in the interference direction. This implies that a large amount of the signal power leaks into the interference beam. This leads to a substantial amount of signal suppression and the presence of residual interference when the PIC is optimized. This aspect of the PIC is now considered and expressions for the mean output signal power and the mean output noise power of the optimal PIC are presented.
Substituting for U and V in (6.48), you obtain an expression for the weight wˆc of the optimal PIC using the conventional interference beamformer (CIB):
| (6.52) | |
| Substituting for R, this leads to | |
 |
(6.53) |
| where β is a normalized dot product of S0 and SI, defined as β = (S0)H*S1/L. |
| (6.54) | |
 |
(6.55) |
 |
(6.56) |
| and | |
 |
(6.57) |
| where | |
 |
(6.58) |
is the SNR at the output of the interference beam. Since the SNR is a positive quantity and the parameter ρ is not more than unity, it follows from (6.54) that the signal power at the output of the optimal PIC using the CIB is less than the signal power at the output of the signal beam. Hence, the signal has been suppressed by the PIC. Furthermore, the signal suppression increases as (1)the parameter ρ, which depends on the array geometry and the relative directions of the two sources, decreases, and (2) the SNR at the output of the interference beam increases.
Since the SNR at the output of the interference beam is proportional to the input signal power, it follows that signal suppression increases as the input signal power increases. On the other hand, an increase in the interference power as well as the uncorrelated noise power at the input of the PIC decreases the SNR at the output of the interference beam and, hence, decreases the signal suppression of the optimal PIC using the CIB.Physically, the signal suppression by the optimal PIC using the CIB arises from the leakage of the signal into the interference beam. The component of the signal in the interference beam is subtracted from the signal in the signal beam; in the process of minimization of total output power, this leads to signal suppression. Signal suppression increases as the parameter ρ decreases. The reason for this is that as ρ decreases, the response of the interference beam in the signal direction increases, which increases the signal leakage into the interference beam, causing more signal suppression. To understand the dependency of the signal suppression on αI, the SNR at the output of the interference beam, rewrite (6.53) as
 |
(6.59) |
It follows from (6.59) that as αI increases, the magnitude of w c increases, resulting in an increase of the signal suppression. In the limit, as αI → ∞, wc → β/(1 – ρ). It can easily be verified that for this value of wˆc, the output signal power reduces to zero, resulting in total signal suppression.
The behavior of the output noise power of the optimal PIC using the CIB is described by (6.57). The first term, which is proportional to the uncorrelated noise power at the input of the PIC, decreases as the number of elements in the array increases and the parameter ρ decreases. The second term, which is proportional to the total noise power at the output of the interference beam, also decreases as the parameter ρ decreases and depends on αI. As αI increases, resulting in an increase of wc, the second term on the right side of (6.57) increases. This implies that the output noise power of the optimal PIC using the CIB increases as the input signal power increases.

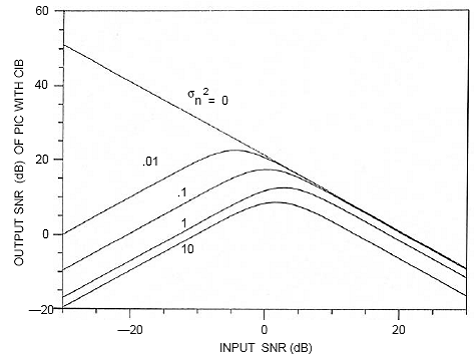
Figure 12 : Output SNR of the PIC using CIB vs. input SNR for a ten-element linear array, θ0 = 90°, PI = 1, θI = 30°.
Let SNR(wc) denote the output SNR of the optimal PIC using the CIB. Then, it follows from (6.54) and (6.57) that
 |
(6.60) |
| (6.61) |
Thus, in the absence of uncorrelated noise, the output SNR of an interference canceler is inversely proportional to the input SNR. In the presence of uncorrelated noise power, the behavior of SNR(wc) is shown in Figure 12.
The results in Figure 12 are for an equally spaced linear array of ten elements, with inter-element spacing of one-half wavelength. The signal source is assumed to be broadside to the array, and an interference source of unity power is assumed 60° off broadside. For this array configuration and source scenario, the parameter ρ is equal to 0.99. Figure 12 shows that the presence of uncorrelated noise changes the behavior of SNR(wc) dramatically, particularly for low-input SNR. In the absence of uncorrelated noise, the PIC using the CIB is able to cancel most of the interference when the input SNR is small, resulting in high-output SNR. The presence of uncorrelated noise increases the total output noise significantly (see Equation 6.57), resulting in a substantial drop in the output SNR.
PIC with Orthogonal Interference Beamformer is discussed here.
PIC with Improved Interference Beamformer is discussed here.
Back to PIC.
Back To Contents .